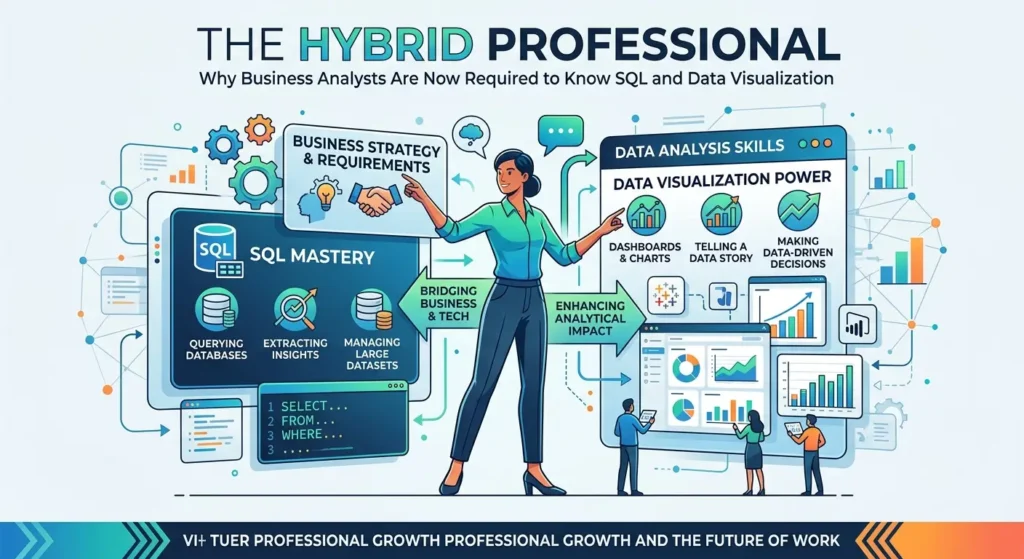
Think of a business analyst the way you would a skilled cartographer — not merely someone who reads maps, but someone who draws them from scratch. A cartographer doesn’t just describe the terrain; they translate raw geography into something a general can use to command armies, or a merchant can use to chart profitable routes. Today’s business analyst does exactly that — converting the chaotic landscape of organizational data into actionable intelligence that drives decisions worth millions.
But the terrain has shifted. The maps now require different instruments. And the modern cartographer who doesn’t understand SQL and data visualization is handing in a blank sheet.
When Intuition Alone Stopped Being Enough
For decades, business analysts thrived on process maps, stakeholder interviews, and requirement documents. That era is fading fast. Businesses today generate staggering volumes of operational data — from CRM pipelines to customer behaviour logs — and the analyst who cannot independently interrogate that data is perpetually dependent on someone else’s interpretation.
SQL changed everything. It gave analysts direct access to the raw terrain — no waiting for a developer, no filtered reports handed down from a data team. An analyst who can write a query to pull six months of churn data by product tier isn’t just faster; they’re fundamentally more credible in every room they enter. Enrolling in a well-structured business analyst course that covers SQL fundamentals has become one of the most high-ROI career decisions a mid-career professional can make.
The Language That Every Database Speaks
SQL is not a niche developer skill anymore. It is the lingua franca of structured data — and business analysts who master it gain something remarkable: the ability to ask their own questions. Not the questions someone else anticipated, but the precise, contextually relevant questions that emerge during live stakeholder discussions.
Consider how a logistics company’s planning team once struggled with inventory forecasting. Every time they needed a custom cut of warehouse movement data, requests would sit in a development queue for days. Once the analysts learned to write their own SQL queries directly against the inventory database, turnaround dropped from five days to twenty minutes. That speed didn’t just save time — it changed the quality of decisions made in weekly planning meetings, because the data was fresh, not stale.
Seeing What the Numbers Are Saying
Numbers sitting in rows and columns are whispers. A well-constructed visualization is a shout. The ability to transform a pivot table into an intuitive dashboard — one that a CFO can absorb in thirty seconds — is no longer a “nice to have” skill for analysts. It is table stakes.
Data visualization forces clarity. When you must represent a trend in a chart, you cannot hide behind ambiguity. You must understand the story the data is telling and commit to telling it visually. Analysts who complete a rigorous business analyst course today will find that visualization modules — covering tools like Tableau, Power BI, and even Python’s matplotlib — feature prominently alongside SQL and requirements engineering.
The shift here is profound: an analyst who can both extract data and present it compellingly removes an entire layer of organizational friction.
The Hybrid Professional Is Not a Unicorn — It’s an Expectation
There is a common misconception that asking analysts to know SQL and visualization is asking them to become data scientists. It isn’t. The goal isn’t statistical modelling or machine learning. The goal is fluency — a working command of data tools sufficient to answer business questions independently, present findings persuasively, and collaborate effectively with technical teams.
Organisations have quietly rewritten their job descriptions to reflect this. Analyst roles at growth-stage companies and large enterprises alike now list SQL proficiency and visualization experience as required, not preferred. The analyst who brings both a structured business mindset and technical data literacy is no longer exceptional — they’re simply employable.
Conclusion: Draw the Map or Lose the Territory
The cartographer analogy holds all the way to the end. In an age where every organization is swimming in data, the business analyst who cannot navigate that data independently is drawing maps from memory — useful sometimes, dangerously wrong at others. SQL and data visualization are not add-ons to the analyst’s toolkit. They are the toolkit.
The professionals who will lead strategy discussions, earn stakeholder trust, and shape organizational direction in the coming decade will be those who learned to ask the right questions directly from the data — and then made those answers impossible to ignore.
Name – ExcelR- Data Science, Data Analytics, Business Analytics Course Training Mumbai
Address – 304, 3rd Floor, Pratibha Building. Three Petrol pump, Lal Bahadur Shastri Rd, opposite Manas Tower, Pakhdi, Thane West, Thane, Maharashtra 400602
Phone No – 9108238354
Email ID – enquiry@excelr.com