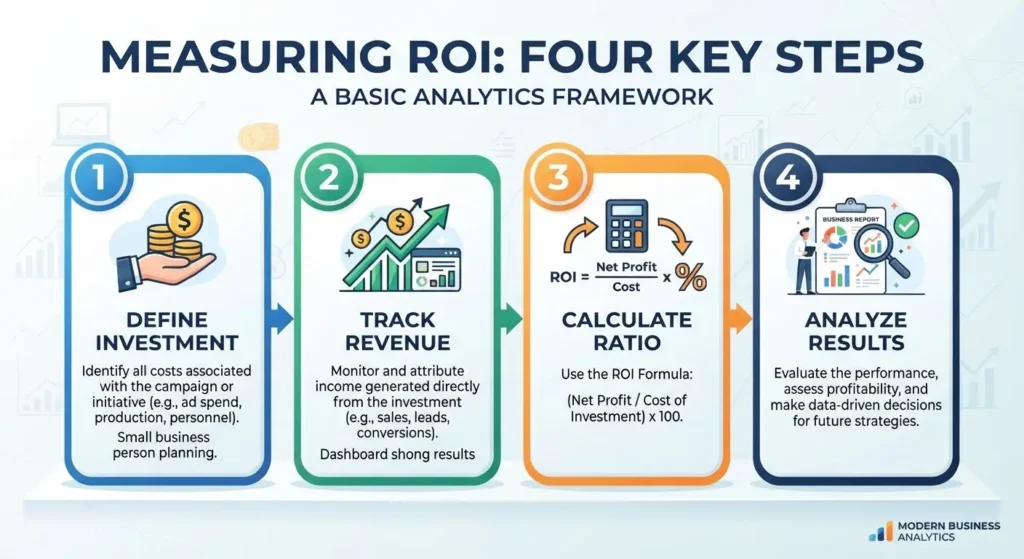
Picture a farmer standing at the edge of a field he just planted. He didn’t scatter seeds and walk away hoping for magic — he tracked rainfall, sunlight, and soil quality, then compared it all to the size of his harvest. That, in essence, is what measuring ROI feels like. It isn’t a dry financial ritual; it’s the art of watching what you plant grow into something you can actually count, weigh, and sell. Analytics is simply the farmer’s notebook — the tool that turns guesswork into a story with numbers as its characters.
For businesses drowning in dashboards and vanity metrics, this metaphor matters. Too many teams measure activity instead of harvest — clicks instead of crops. Basic analytics techniques exist to separate the noise from the nourishment.
The Seed and the Soil: Understanding What You’re Really Measuring
Before any harvest can be measured, you need to know what was planted. In business terms, this means clearly defining the investment — money, time, or effort — before chasing the return. A marketing team that spends without tagging campaigns is like a farmer who forgets which rows he seeded. When the investment is untracked, the return becomes a mystery wrapped in a spreadsheet. Simple attribution tagging, UTM parameters, and campaign-level budgeting are the “soil tests” that tell you what’s growing where.
Watching the Weather: Tracking Behavior Over Time
Rain doesn’t fall evenly, and neither does customer behavior. Basic trend analysis — plotting engagement, conversions, or revenue across weeks and months — helps you see patterns the way a farmer reads clouds. A sudden spike after an email campaign is a rain shower; a slow decline over quarters is a drought warning. Tools as simple as spreadsheet pivot tables or free analytics platforms can reveal these patterns without needing a data science degree. This is often the first skill taught in any structured data analyst course , because trend-spotting is the foundation everything else is built upon.
The Scale and the Basket: Comparing Cost to Outcome
Once the crop is in, the farmer weighs the basket against the cost of seeds, tools, and labor. In business, this translates to the simplest ROI formula: (Return minus Investment) divided by Investment. It sounds almost too plain to matter, yet most companies skip this basic weighing exercise. They celebrate “more leads” without asking what those leads cost, or “more traffic” without asking if it converted. A basket that’s overflowing but cost twice as much to fill isn’t necessarily a win — it just feels like one.
The Storyteller’s Lens: Segmenting Data for Clarity
A single number rarely tells the truth. A harvest report that says “500 kilograms of vegetables” hides whether that came mostly from tomatoes or a handful of stubborn potatoes. Segmentation — breaking ROI down by channel, audience, or product — acts like sorting the harvest into separate baskets. Suddenly, you see that one channel is quietly outperforming three others combined, while another has been draining resources without anyone noticing. This is where analytics stops being a formula and starts being a narrative, one that reveals which parts of the business are thriving and which are merely surviving on borrowed sunlight.
The Almanac: Building Long-Term Measurement Habits
The best farmers keep almanacs — records built over seasons, not single harvests. Similarly, ROI measurement isn’t a one-time calculation; it’s a habit of consistent tracking, benchmarking, and revisiting assumptions as markets shift. Professionals who invest in a data analytics course often do so precisely for this reason: not to learn a single formula, but to build the discipline of continuous, structured observation. The almanac isn’t glamorous, but it’s what separates lucky harvests from repeatable ones.
Conclusion
Measuring ROI isn’t about drowning in complex models or intimidating jargon. It’s about becoming a careful gardener of your own decisions — tracking what you plant, watching the weather of behavior, weighing the harvest honestly, and sorting the results into a story that makes sense. The tools are basic: trend lines, cost comparisons, segmentation, and consistent record-keeping. What separates the confused from the confident isn’t fancier software — it’s the patience to measure, season after season, until the numbers finally start telling the truth.
For more details, visit us:
Business Name: ExcelR – Data Analyst & Gen AI Course in Bhubaneswar
Address: 3rd Floor, BMC Bhawani Mall, Saheed Nagar, Bhubaneswar, Odisha 751007
Phone Number: 7026017870