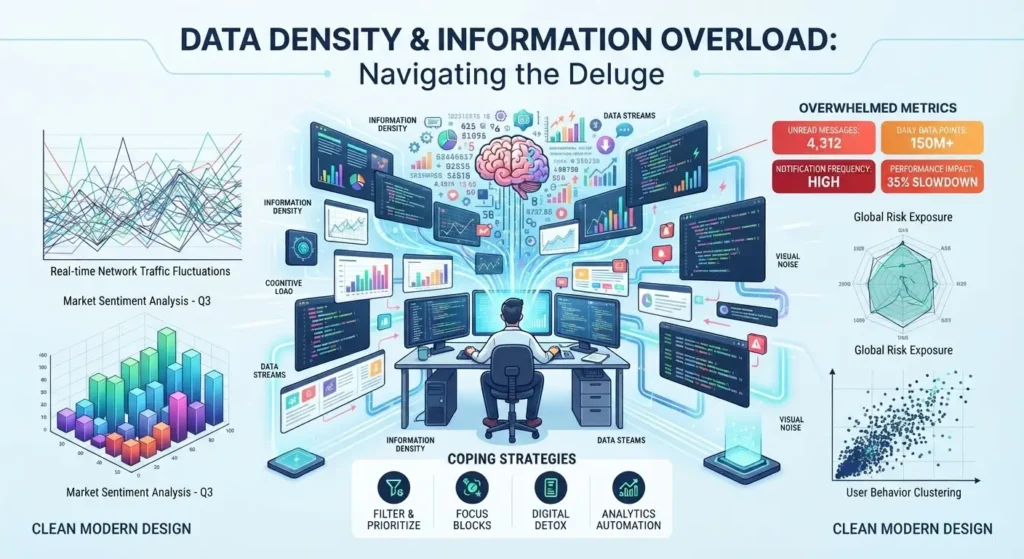
Envision a kitchen spice shelf. A small amount of cumin enhances a dish while a large, excessive portion overwhelms it. Likewise, data functions in the same manner. Each dataset has a certain “flavor” of information per unit of space, time, or attention, and this flavor is what we refer to as data density. It’s not just a matter of quantity. A dataset can be very large yet quite sparse, resembling a diluted broth, or on the other hand small yet extremely concentrated, such as a single drop of chili oil that alters the entire bowl. The actual question that currently directs modern decision-making is not “How much data do we have?” but “How much of it can a human or a system actually detect before it ceases to make sense?”
The Spice Rack Problem: Density Versus Volume
Taking volume for density is one of the biggest errors made in data strategy. A spreadsheet containing ten million rows could be less ‘dense’ than a single dashboard with fifty data points, since density refers to the amount of meaning that can be picked up at a glance, not to the number of rows in a file. People who have used a messy analytics dashboard will be familiar with that experience: having numerous charts on top of one another, colors vying for attention, and numbers updating faster than the eye can follow. This kind of feeling is known as data oversaturation, which occurs when adding one more metric doesn’t bring any new insight but instead takes it away. This is exactly the kind of instinct that a well-structured course for data analyst course aims to develop from the very beginning by teaching students to distinguish between the variables that carry meaningful information and those that are just decorative before any charts are drawn.
The Cockpit Effect: When More Instruments Mean Less Awareness
Imagine the cockpit of an airplane in the 1970s, with a large number of analog dials all taking up space and each one requiring a small part of the pilot’s attention. Aviation engineers soon came to the conclusion that putting in more instruments didn’t make flying safer since it spread the pilot’s awareness too thinly across so many conflicting signals. The solution was not to eliminate the information but to redesign the way it was presented, grouping together related readings so that the pilot could scan them rather than having to search for them. This is what data density management is all about: it has nothing to do with deleting information, but rather with arranging it so that the brain can take it in in the order that is most important at the moment when it is most important.
The Library Shelf: Depth Without Chaos
Suppose there was a library in which the books were not arranged by category but instead placed on shelves according to the day they arrived. Although, in a technical sense, nothing is missing—every title is indeed somewhere within the building—the library is of no practical use since the time it takes to retrieve a book becomes impossible to manage due to the lack of order. Likewise, dense data acts in the same manner. A company might keep for years transaction records, customer feedback, and sensor data, but if this information is not indexed or given context, the density of the data becomes a disadvantage rather than an advantage. Dense data only becomes valuable when it is deliberately organized: by means of tagging, structuring, and cross-referencing so that a single query can obtain precisely what is required without having to go through all the rest.
The Flood and the Faucet: Finding the Right Flow Rate
The distinction between a faucet and a flood is that a faucet supplies water at a rate that the glass can hold, whereas a flood releases the same amount all at once and damages everything in its way. Real-time monitoring systems in the fields of logistics, healthcare, and finance constantly navigate this balance. If the amount of data is too small, the system will respond too late; if it is too great, the operators are overwhelmed by the number of alerts and eventually turn them off completely, a situation which researchers refer to as “alert fatigue”. The most effective systems adjust their faucet setting, sending out concentrated information in controlled bursts rather than in a constant stream, thus maintaining both accuracy and human attention.
Learning to Read the Room: Building Data Literacy
In the end, dealing with data density is a matter of literacy rather than merely an engineering issue. The teams that succeed are those who, before producing any report, ask themselves: who is going to be using this report and how thirsty are they? This is the kind of mindset that a well-thought-out data analyst course fosters not just familiarity with the tools, but a well-disciplined sense of proportion, enabling practitioners to cut back, group, and control the amount of information so as to make it informative rather than overwhelming.
Conclusion: The Art of Enough
You shouldn’t blindly pursue higher data density; instead, you need to find a balance through experience, just as a chef tastes his food while preparing it. If you put in too little seasoning, the insights will be tasteless, and if you put in too much, they’ll be inedible. The aim has never been to gather as much information as possible, but always to collect just the right amount, in the correct arrangement, so that those who rely on it can actually perceive the difference it makes.
For more details, visit us:
Business Name: ExcelR – Data Analyst, Gen AI & Agentic AI Course in Delhi
Address: 4th Floor, 10-B, Pusa Rd, Block A, Rajendra Park, Rajinder Nagar, New Delhi, Delhi 110060
Phone Number:917026018552
Email ID: enquiry@excelr.com